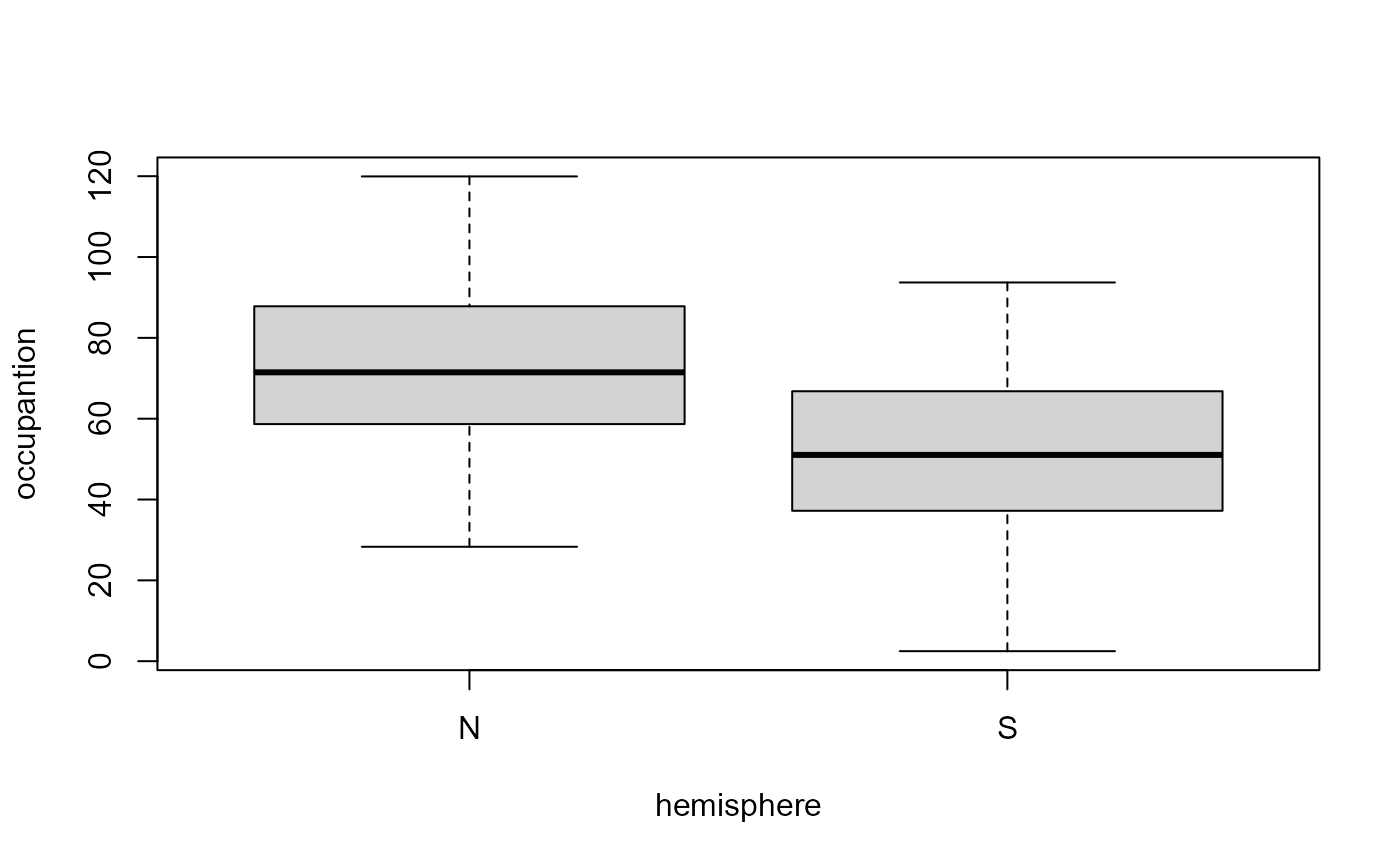
A Spaniard-Argentinian hotel company wants to control the level of occupancy (measured in application of a continuous control. For this purpose, 48 subsamples have been taken from six hotels corresponding to two different countries.
Format
A data frame with 288 observations on the following 3 variables:
- occupantion
The amount of occupants in terms of percentage
- sample
Sample ID
- hemisphere
Hemisphere
Examples
data(employment)
attach(employment)
summary(employment)
#>   occupantion          sample      hemisphere
#>  Min.   :  2.478   Min.   : 1.00   N:144
#>  1st Qu.: 48.046   1st Qu.:12.75   S:144
#>  Median : 63.376   Median :24.50
#>  Mean   : 62.748   Mean   :24.50
#>  3rd Qu.: 78.423   3rd Qu.:36.25
#>  Max.   :119.943   Max.   :48.00
boxplot(occupantion ~ hemisphere)

plot(occupantion, type="b")

detach(employment)
