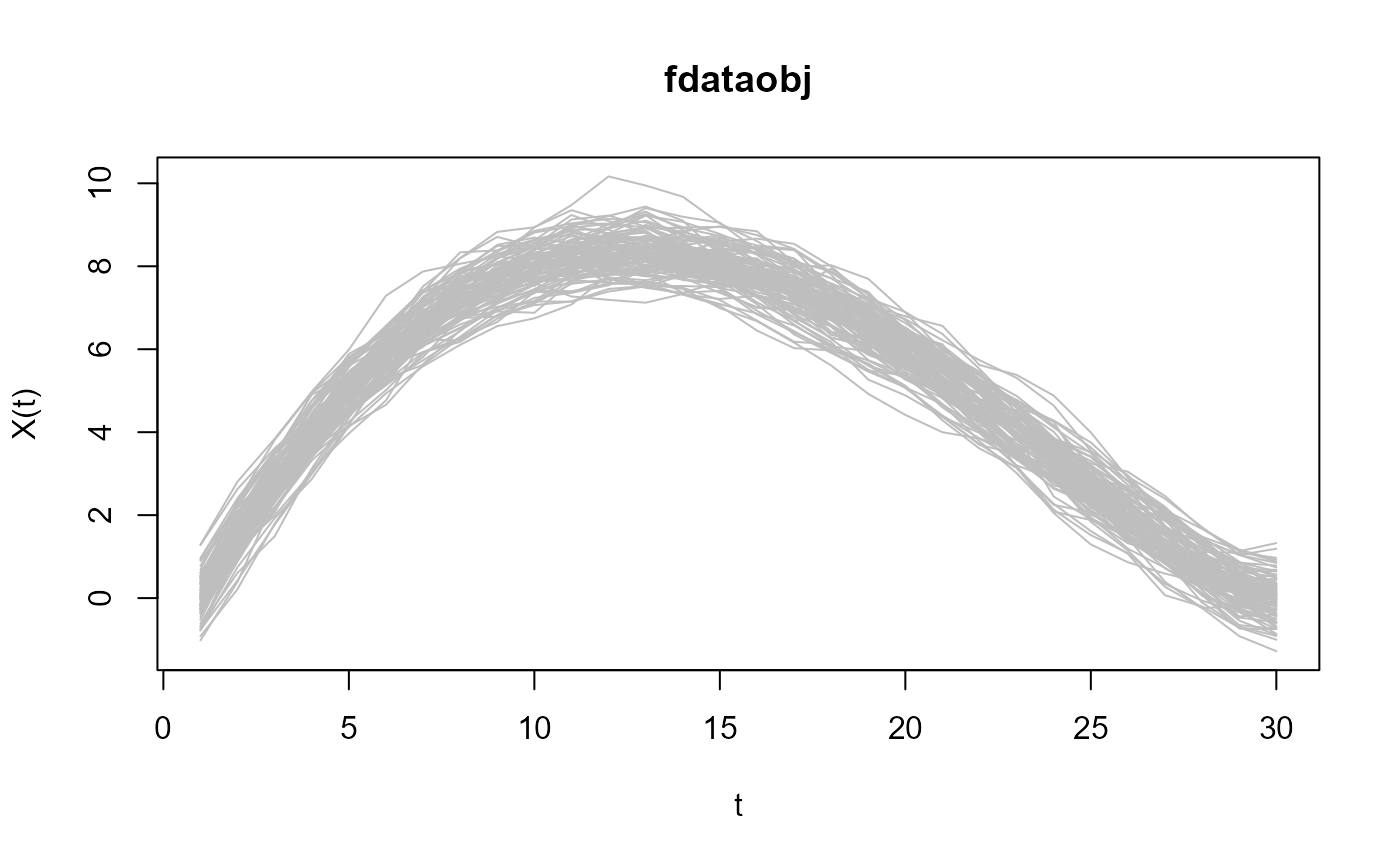
Create an object of class 'fdqcd' to perform statistical quality control. This object is used to plot Functional Data Control Charts.
Arguments
- x
Matrix of set cases with dimension (n x m), where 'n' is the number of curves and 'm' are the points observed in each curve.
- data.name
A string that specifies the title displayed on the plots. If not provided it is taken from the name of the object
x.- ...
Arguments passed to or from methods.

