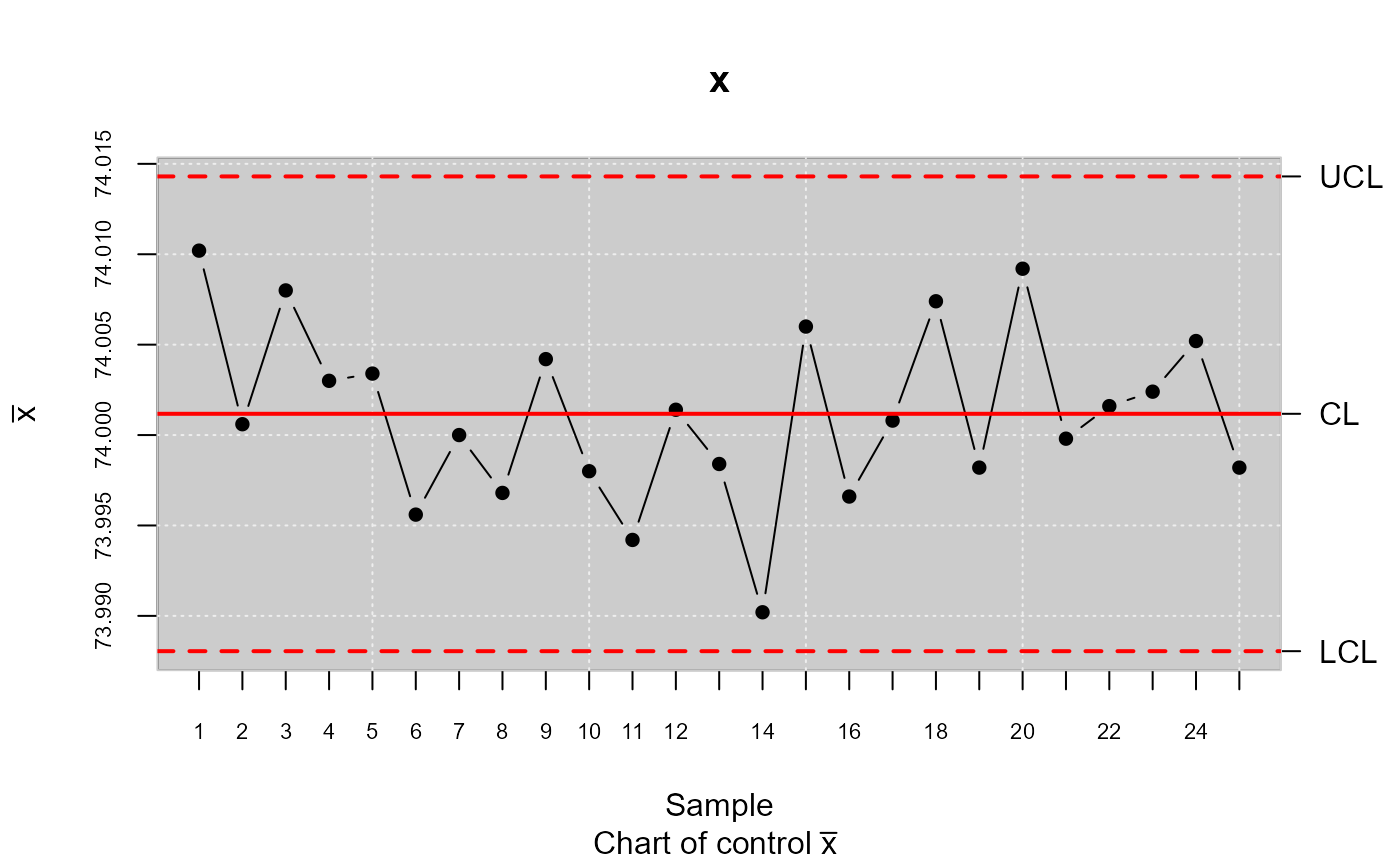
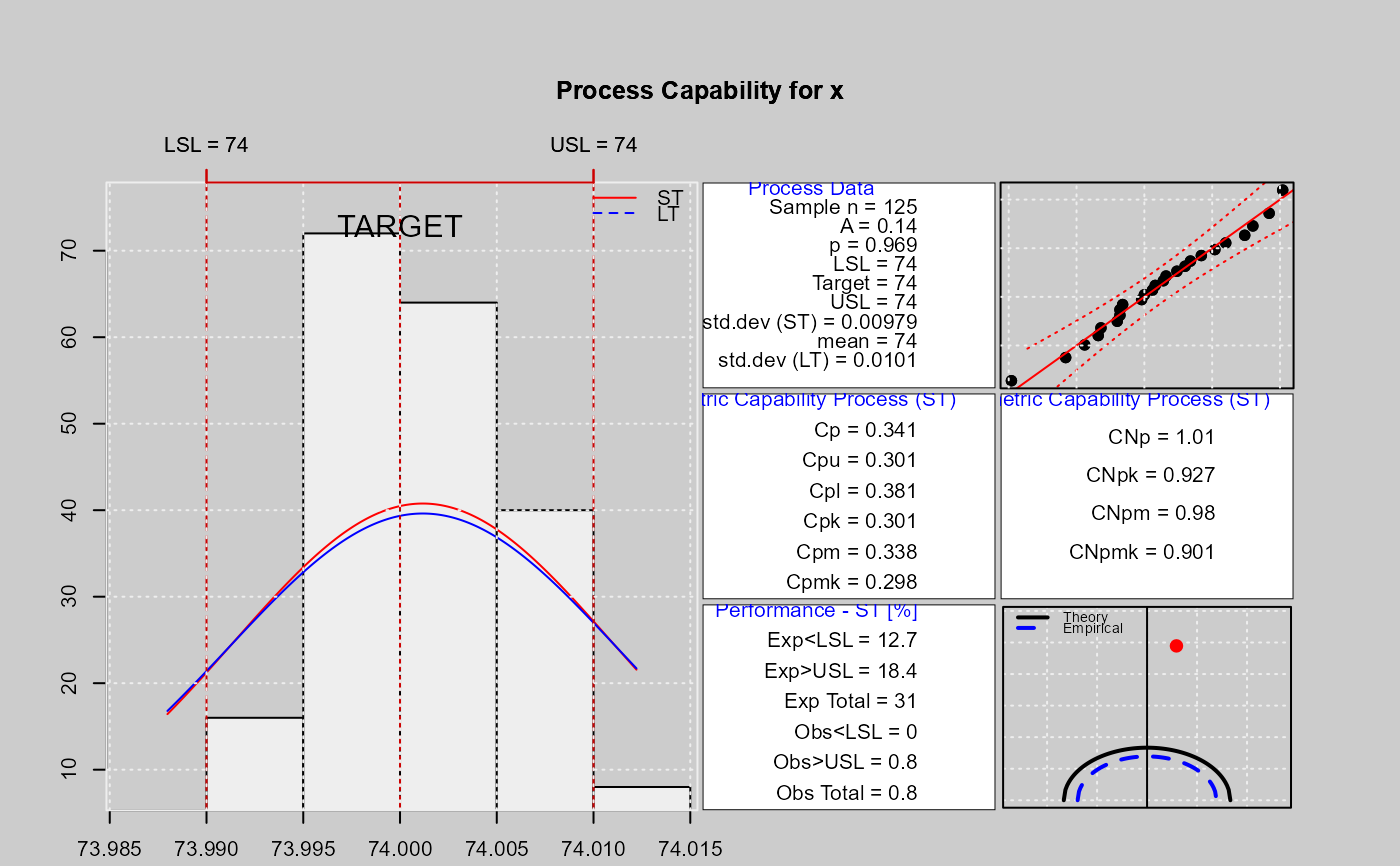
Calculates the process capability indices Cp, Cpk, Cpl, Cpu, Cpm, Cpmk for a qcs object and normal distribution. Also, this function calculates confidence limits for \(C_p\) using the method described by Chou et al. (1990). Approximate confidence limits for \(C_{pl}\), \(C_{pu}\) and \(C_{pk}\) are computed using the method in Bissell (1990). Confidence limits for \(C_{pm}\) are based on the method of Boyles (1991); this method is approximate and it assumes the target is midway between the specification limits. Moreover, calculates the process capability indices CNp, CNpk, CNpm, CNpmk for a qcs object. A histogram with a density curve is displayed along with the specification limits, a Quantile-Quantile Plot for the specified distribution and contour graph is plotted for estimate the index Cpm.
Usage
qcs.ca(
  object,
  limits = c(lsl = -3, usl = 3),
  target = NULL,
  std.dev = NULL,
  nsigmas = 3,
  confidence = 0.9973,
  plot = TRUE,
  main = NULL,
  ...
)
Arguments
- object
qcs object of type
"qcs.xbar"or"qcs.one".- limits
A vector specifying the lower and upper specification limits.
- target
A value specifying the target of the process. If it is
NULL, the target is set at the middle value between specification limits.- std.dev
A value specifying the within-group standard deviation.
- nsigmas
A numeric value specifying the number of sigmas to use.
- confidence
A numeric value between 0 and 1 specifying the probabilities for computing the quantiles. This values is used only when
objectvalues is provided. By defaultconfidence=0.9973.- plot
Logical value indicating whether graph should be plotted.
- main
Title of the plot.
- ...
Arguments to be passed to or from methods.
References
Montgomery, D.C. (1991) Introduction to Statistical Quality Control, 2nd
ed, New York, John Wiley & Sons.
Tong, L.I. and Chen, J.P. (1998), Lower con???dence limits of process capability
indices for nonnormal process distributions. International Journal of Quality & Reliability Management,
Vol. 15 No. 8/9, pp. 907-19.
Vannman, K (1995) A Unified Approach to Capability Indices. Statitica Sinica,5,805-820.
Vannman, K. (2001). A Graphical Method to Control Process Capability. Frontiers in Statistical Quality Control,
No 6, Editors: H-J Lenz and P-TH Wilrich. Physica-Verlag, Heidelberg, 290-311.
Hubele and Vannman (2004). The E???ect of Pooled and Un-pooled Variance Estimators on Cpm When Using Subsamples.
Journal Quality Technology, 36, 207-222.
Examples
library(qcr)
data(pistonrings)
xbar <- qcs.xbar(pistonrings[1:125,],plot = TRUE)

LSL=73.99; USL=74.01
limits = c(lsl = 73.99, usl = 74.01)
qcs.ca(xbar, limits = limits)
#>
#> Process Capability Analysis
#>
#> Call:
#> qcs.ca(object = xbar, limits = limits)
#>
#> Number of obs = 125          Target = 74
#>        Center =  74               LSL =  73.99
#>        StdDev =  0.009785         USL =  74.01
#>
#> Paremetric Capability indices:
#>
#>        Value    0.1%   99.9%
#> Cp    0.3407  0.2771  0.4065
#> Cp_l  0.3807  0.2739  0.4875
#> Cp_u  0.3006  0.2021  0.3991
#> Cp_k  0.3006  0.1944  0.4068
#> Cpm   0.3382  0.2749  0.4038
#>
#>
#> Non parametric Capability indices:
#>
#>         Value
#> CNp    1.0082
#> CNpK   0.9275
#> CNpm   0.9799
#> CNpmk  0.9015
#>
#>
#> PPM:
#>
#>          Exp<LSL 1.267e+07       Obs<LSL 0
#>          Exp>USL 1.836e+07       Obs>USL 8e+05
#>        Exp Total 3.103e+07     Obs Total 8e+05
#>
#> Test:
#>
#>
#> 	Anderson Darling Test for normal distribution
#>
#> data:  xbar
#> Error in round(x$statistic, 4): non-numeric argument to mathematical function

