This function removes observations from the sample which violates the rules of a process under control.
Examples
##
##  Continuous data
##
library(qcr)
data(pistonrings)
str(pistonrings)
#> 'data.frame':	200 obs. of  3 variables:
#>  $ diameter: num  74 74 74 74 74 ...
#>  $ sample  : int  1 1 1 1 1 2 2 2 2 2 ...
#>  $ trial   : logi  TRUE TRUE TRUE TRUE TRUE TRUE ...
pistonrings.qcd<-qcd(pistonrings)

class(pistonrings.qcd)
#> [1] "qcd"        "data.frame"

res.qcs <- qcs.xbar(pistonrings.qcd)
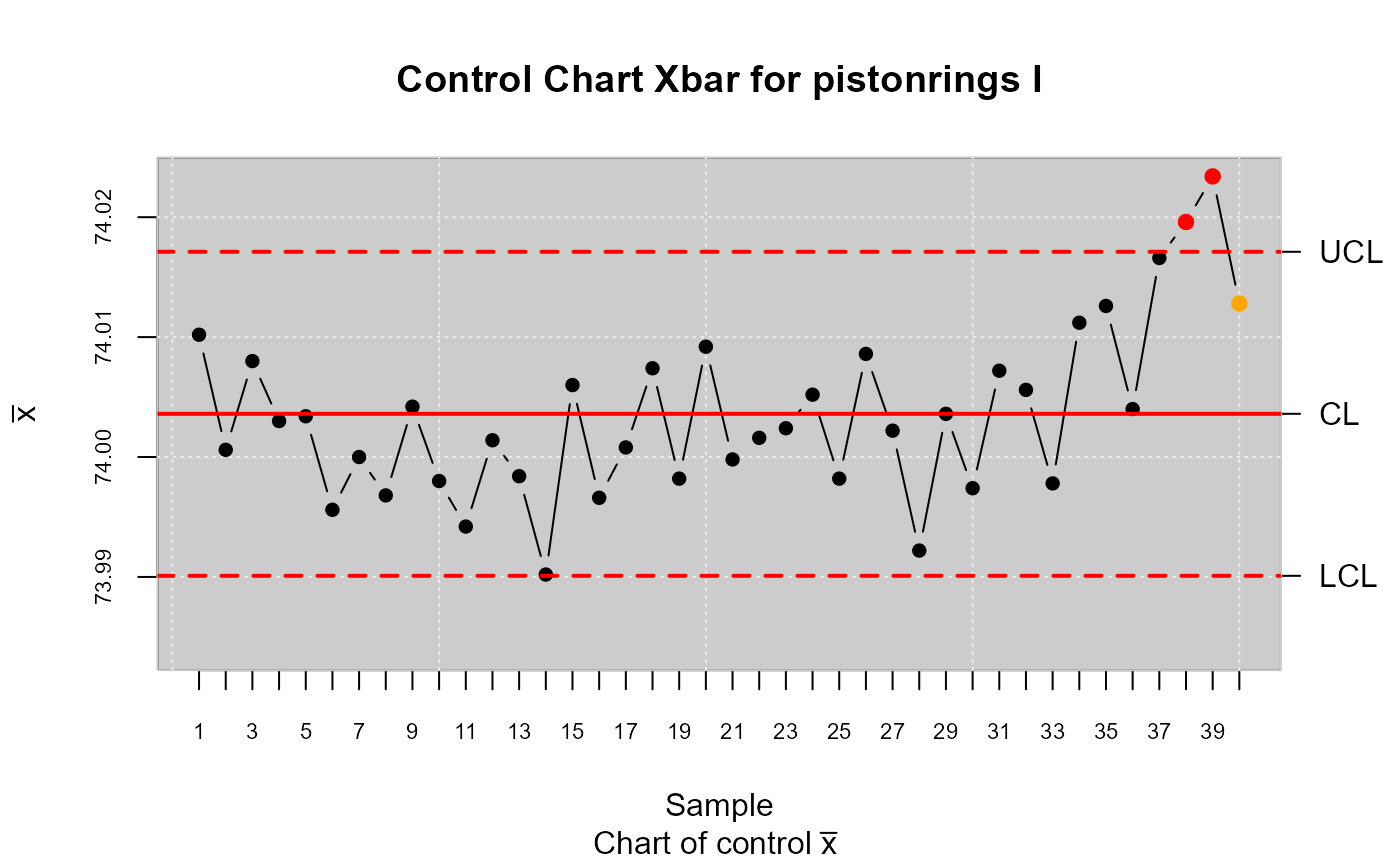
plot(res.qcs,title="Control Chart Xbar for pistonrings I")

summary(res.qcs)
#> xbar chart for pistonrings
#>
#> Summary of group statistics:
#>       xbar
#>  Min.   :73.99
#>  1st Qu.:74.00
#>  Median :74.00
#>  Mean   :74.00
#>  3rd Qu.:74.01
#>  Max.   :74.02
#>
#> Group sample size:  5
#> Number of groups:  40
#> Center of group statistics:  74.0036
#> Standard deviation:  0.01007094
#>
#> Control limits:
#>       LCL      UCL
#>  73.99009 74.01712
#>
#> Beyond limits of control:
#> [1] 74.0196 74.0234
#>
#> Violationg runs:
#> [1] 74.0128

res.qcd <- state.control(res.qcs)
res.qcs <- qcs.xbar(res.qcd)
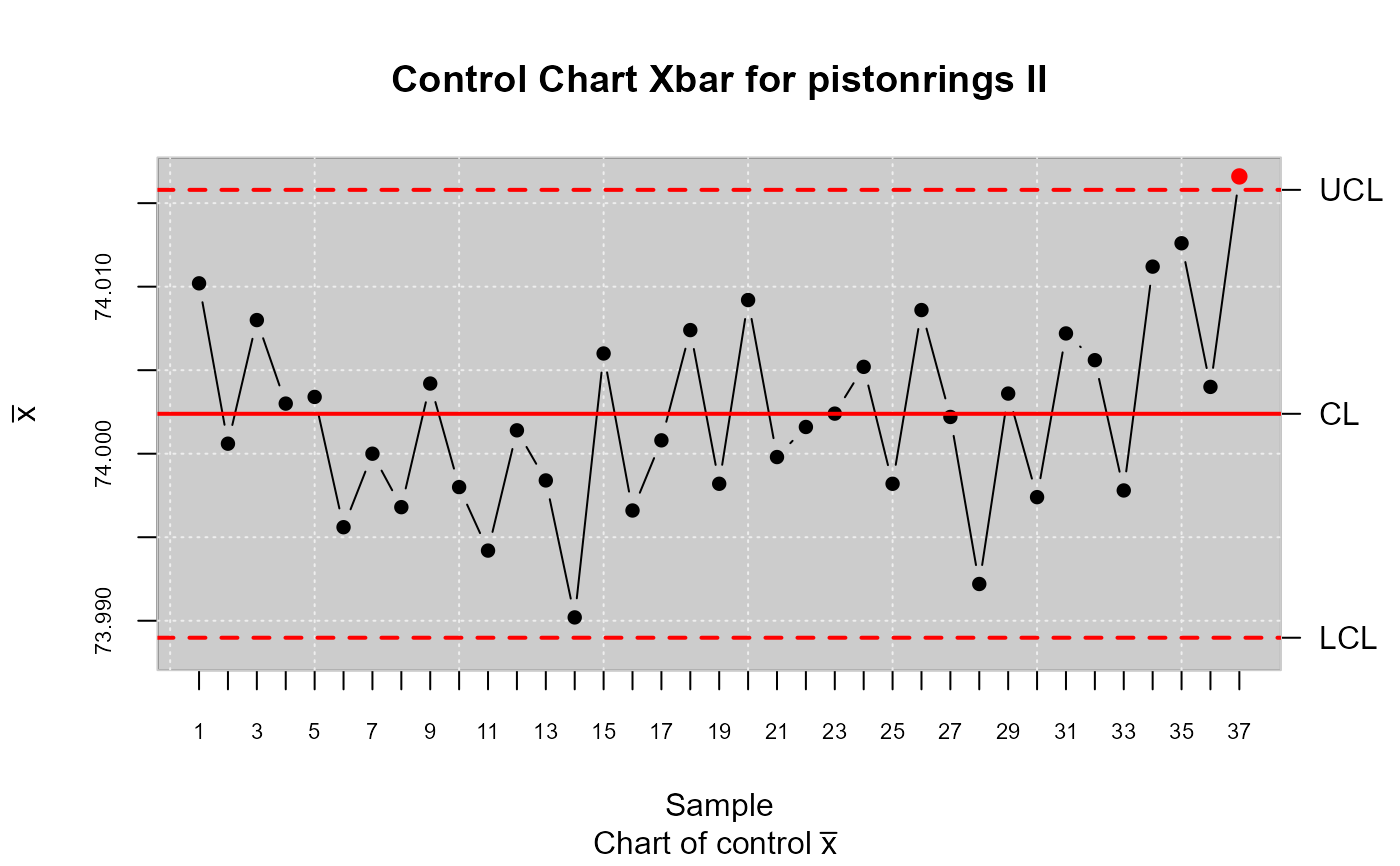
plot(res.qcs,title="Control Chart Xbar for pistonrings II")

summary(res.qcs)
#> xbar chart for pistonrings
#>
#> Summary of group statistics:
#>       xbar
#>  Min.   :73.99
#>  1st Qu.:74.00
#>  Median :74.00
#>  Mean   :74.00
#>  3rd Qu.:74.01
#>  Max.   :74.02
#>
#> Group sample size:  5
#> Number of groups:  37
#> Center of group statistics:  74.00239
#> Standard deviation:  0.009992796
#>
#> Control limits:
#>       LCL     UCL
#>  73.98898 74.0158
#>
#> Beyond limits of control:
#> [1] 74.0166
#>
#> Number violationg runs: 0

res.qcd <- state.control(res.qcs)
res.qcs <- qcs.xbar(res.qcd)
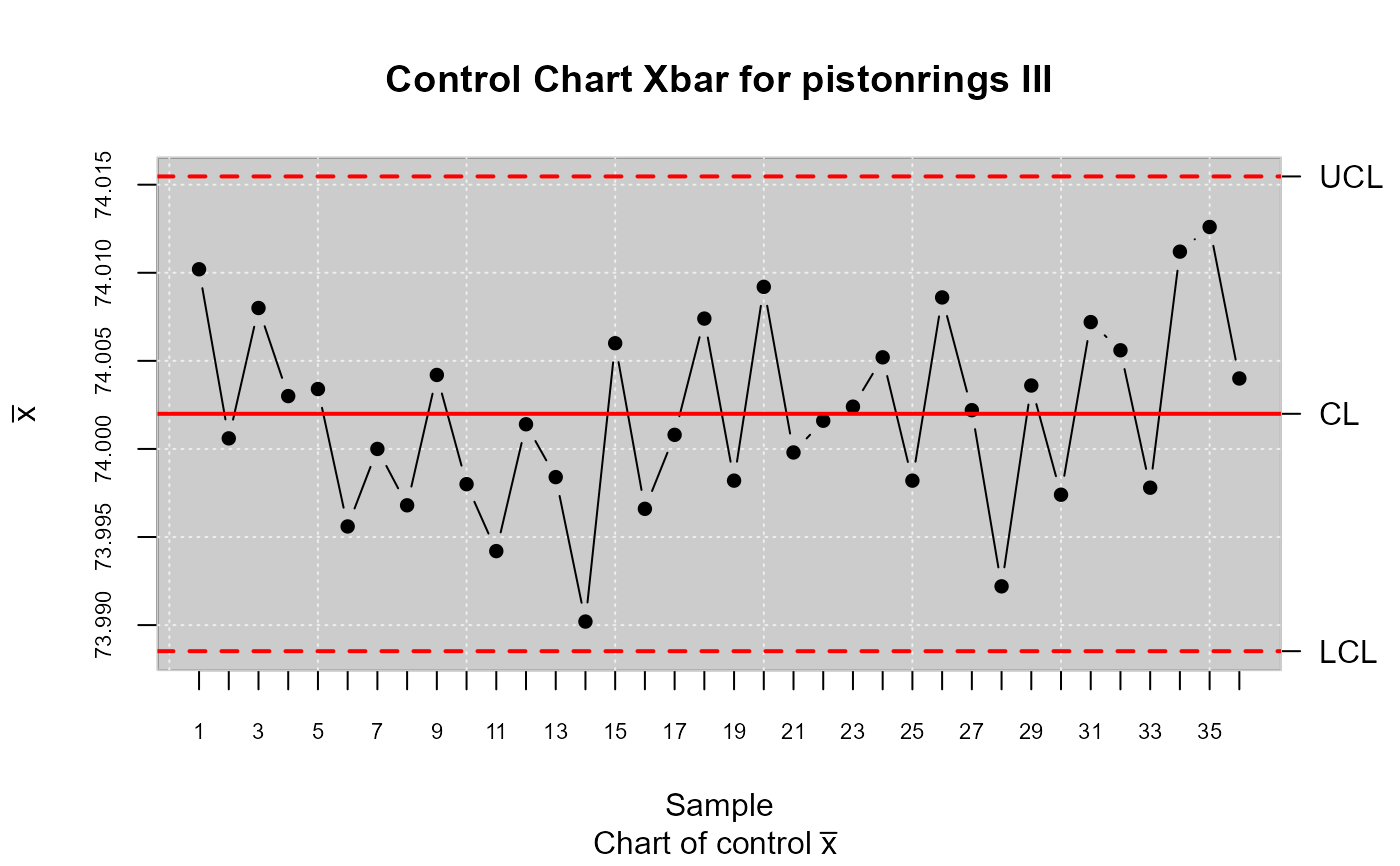
plot(res.qcs,title="Control Chart Xbar for pistonrings III")

summary(res.qcs)
#> xbar chart for pistonrings
#>
#> Summary of group statistics:
#>       xbar
#>  Min.   :73.99
#>  1st Qu.:74.00
#>  Median :74.00
#>  Mean   :74.00
#>  3rd Qu.:74.01
#>  Max.   :74.01
#>
#> Group sample size:  5
#> Number of groups:  36
#> Center of group statistics:  74.00199
#> Standard deviation:  0.01004347
#>
#> Control limits:
#>       LCL      UCL
#>  73.98852 74.01547
#>
#> Number beyond limits: 0
#>
#> Number violationg runs: 0
