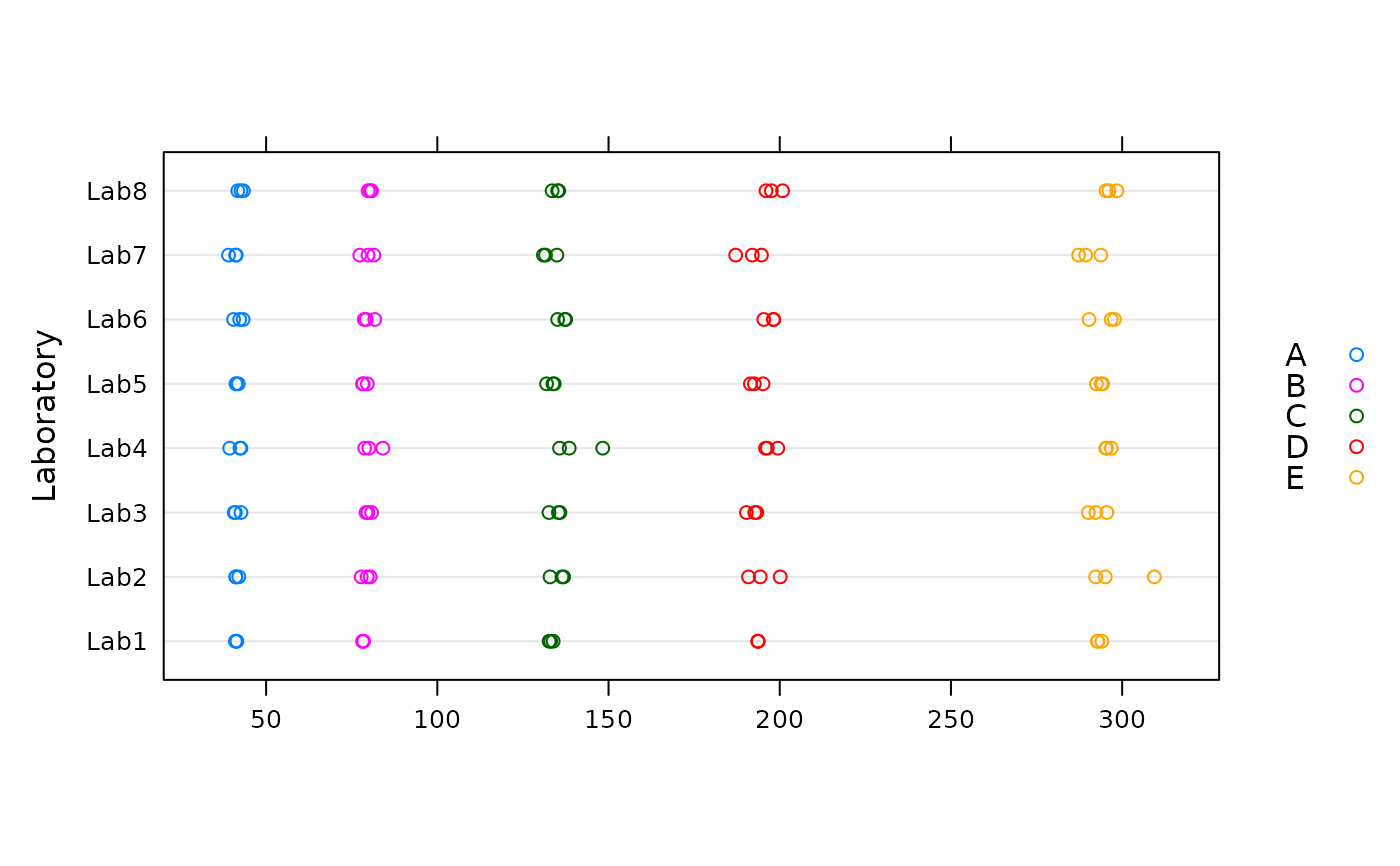
Generic function for plotting objects of 'lab.qcdata' class. Results of univariate ILS studies are graphically shown.
Usage
# S3 method for lab.qcdata
plot(x, xlab = NULL, ylab = NULL, col = "blue", ...)
Arguments
- x
An object of class
lab.qcdata(Univariate Quality Control Data).- xlab
Title for the x axis.
- ylab
Title for the y axis.
- col
Color of type material, when there only one.
- ...
Other arguments to be passed to or from methods.
Examples
library(ILS)
data(Glucose)
Glucose.qcdata <- lab.qcdata(Glucose)
str(Glucose.qcdata)
#> Classes ‘lab.qcdata’ and 'data.frame':	120 obs. of  4 variables:
#>  $ x         : num  41 41.5 41.4 41.2 42 ...
#>  $ replicate : Factor w/ 3 levels "1","2","3": 1 2 3 1 2 3 1 2 3 1 ...
#>  $ material  : Factor w/ 5 levels "A","B","C","D",..: 1 1 1 1 1 1 1 1 1 1 ...
#>  $ laboratory: Factor w/ 8 levels "Lab1","Lab2",..: 1 1 1 2 2 2 3 3 3 4 ...
#>  - attr(*, "data.name")= chr "Glucose"
plot(Glucose.qcdata)