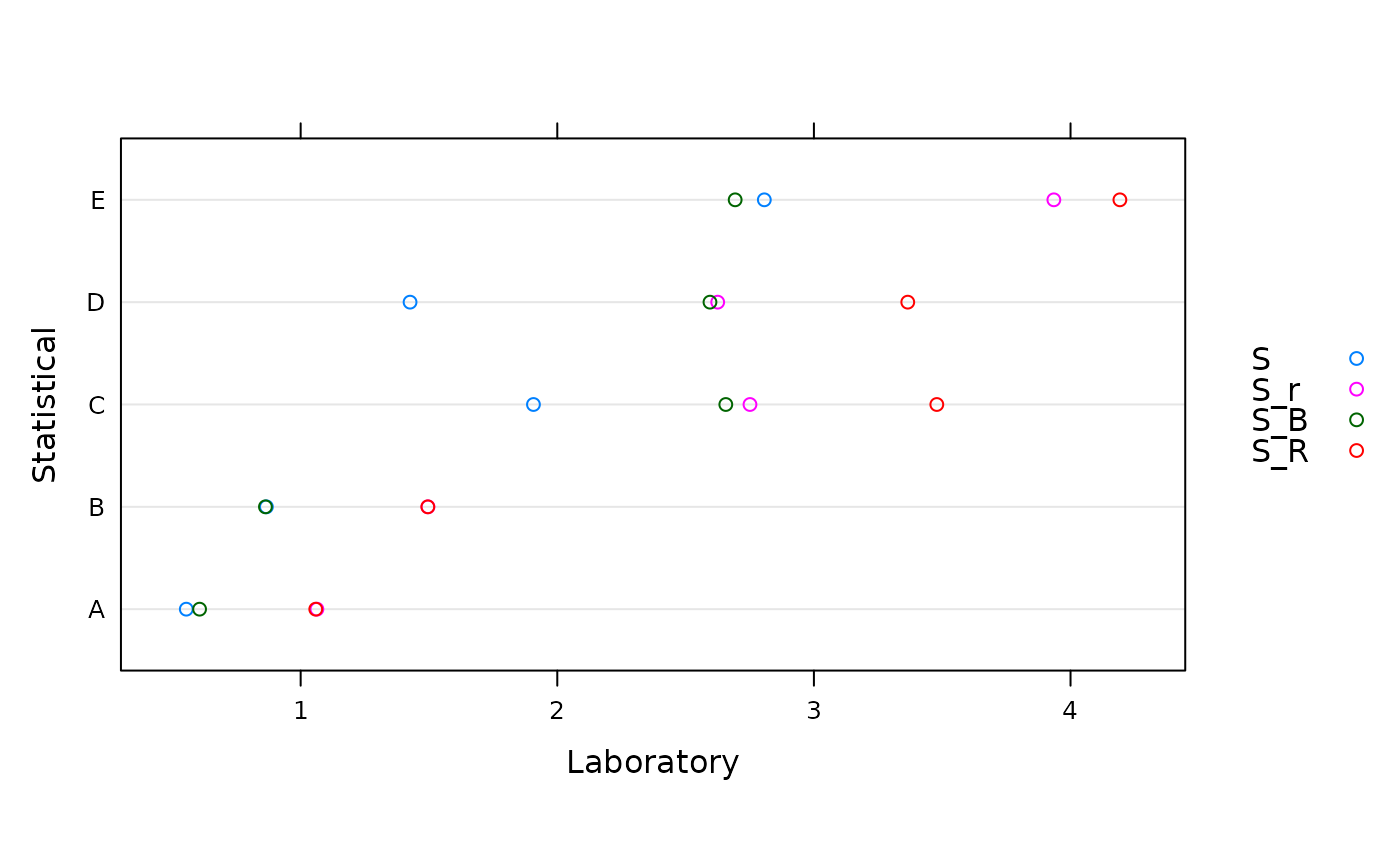
Generic function for plotting objects of 'lab.qcs' class. Results of univariate ILS studies are graphically shown.
Usage
# S3 method for lab.qcs
plot(x, title = NULL, xlab = NULL, ylab = NULL, col = NULL, ylim = NULL, ...)
Arguments
- x
An object of class
lab.qcs(Univariate Quality Control Statistics).- title
Main title for the plot.
- xlab
Title for the x axis.
- ylab
Title for the y axis.
- col
Color specifications.
- ylim
A Numeric vectors of length 2 (coordinates ranges).
- ...
Other arguments to be passed to or from methods.